Theft behaviors analysis in Chicago
Overview
The project is conducted to explore the character traits of theft from a significant amount of raw data - one of the complicated issues in data analysis. To address this challenge, I implement an automated data processing that cleans and normalizes the datasets, then reports to the DBA. Particularly, the DBA uploads the dataset on the server and receives a notification of the status of these pieces of data without performing any actions. Furthermore, in this project, I present a series of approaches to explore data insight. First, I pursue OLAP queries to understand the overview of the theft’s behaviors. Second, I implement a linear regression model to determine what factors affect the increase in theft behaviors in Chicago city. Finally, I build machine learning to predict behavior that is classified as theft or not. You can read the full report here.
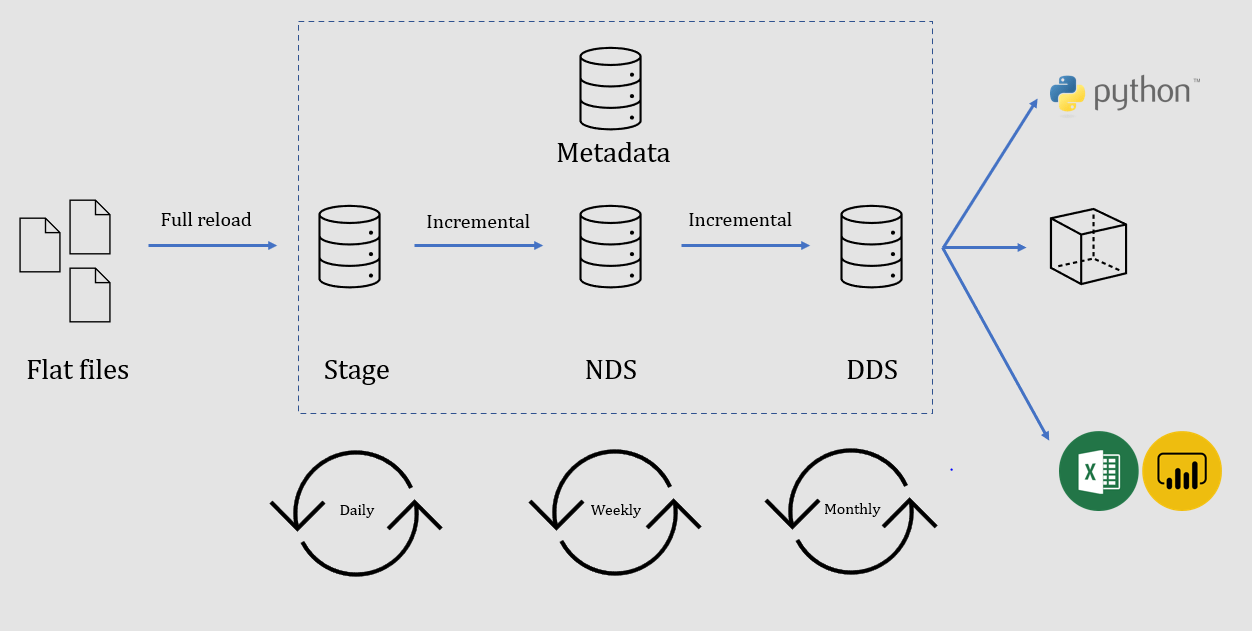
Architecture
The project is structured by Cross-industry standard process for data mining (CRISP-DM):
- Business understanding
- Data understanding
- Data preparation
- Modeling
- Evaluation
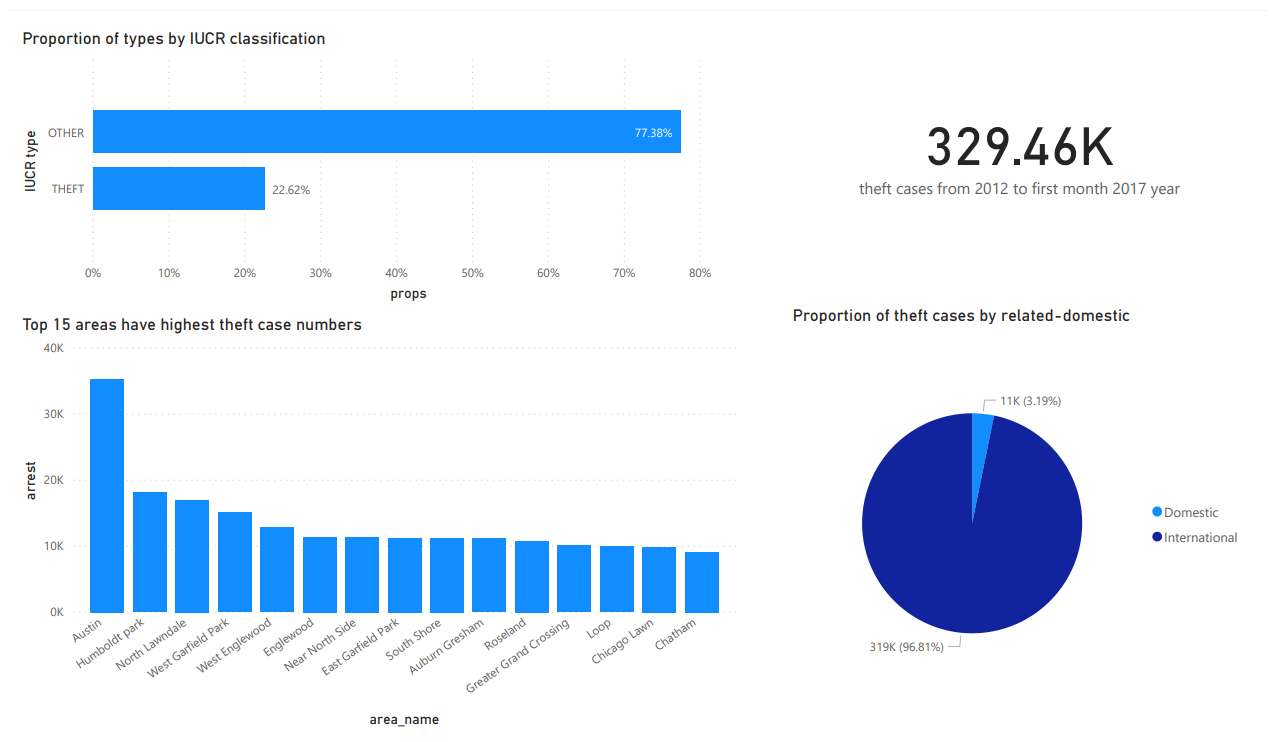
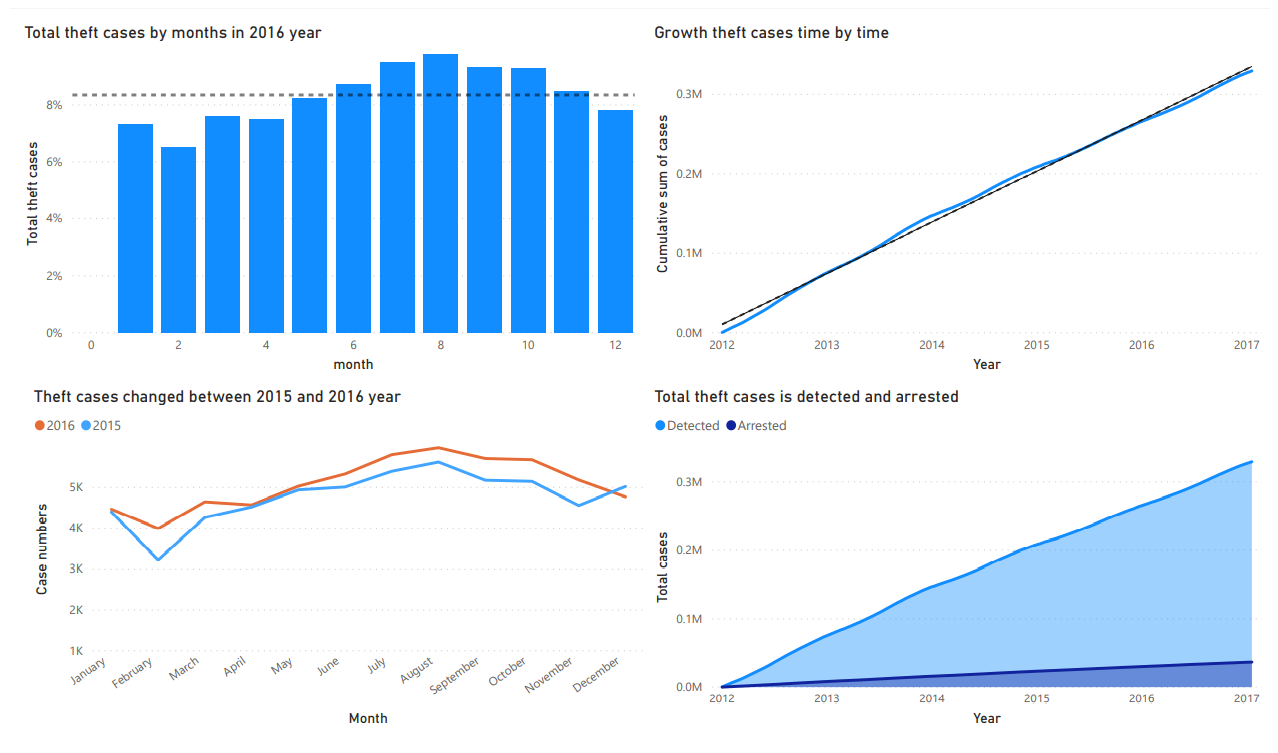
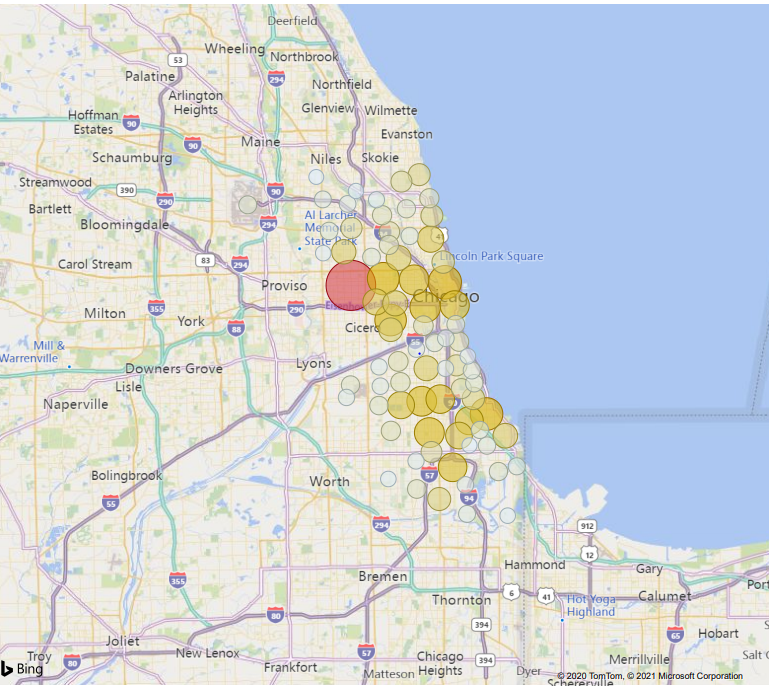
Dashboard
Some dashboards are built using Power BI.
Data mining
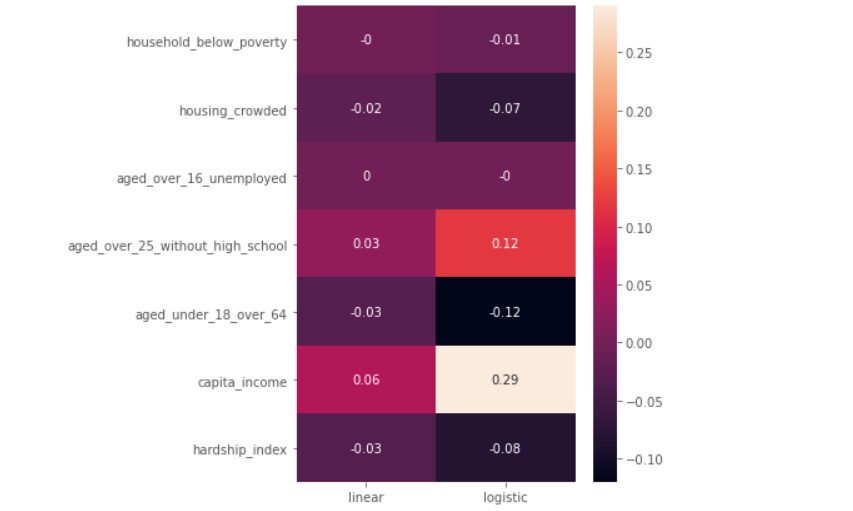
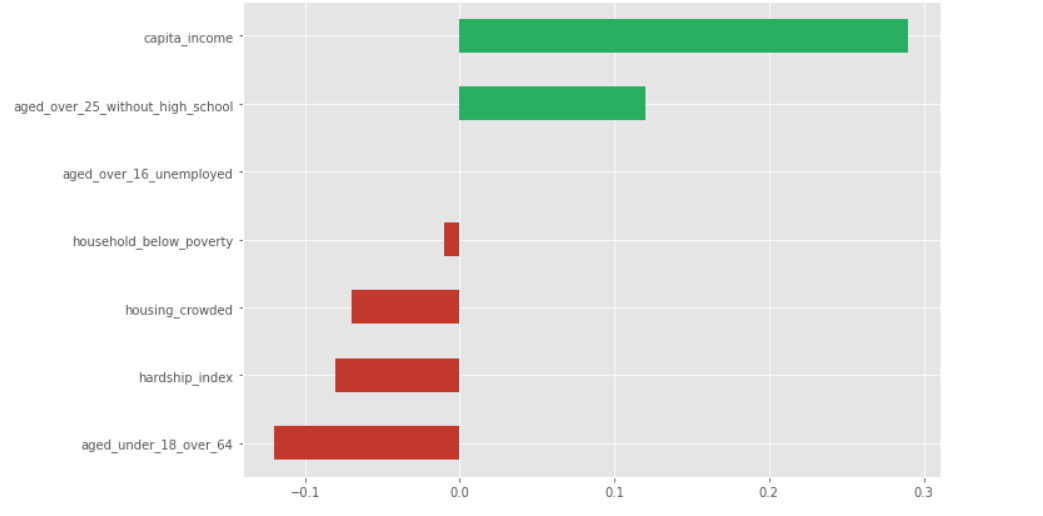
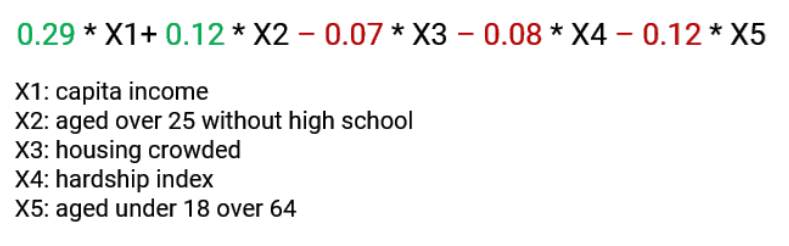
Using linear regression
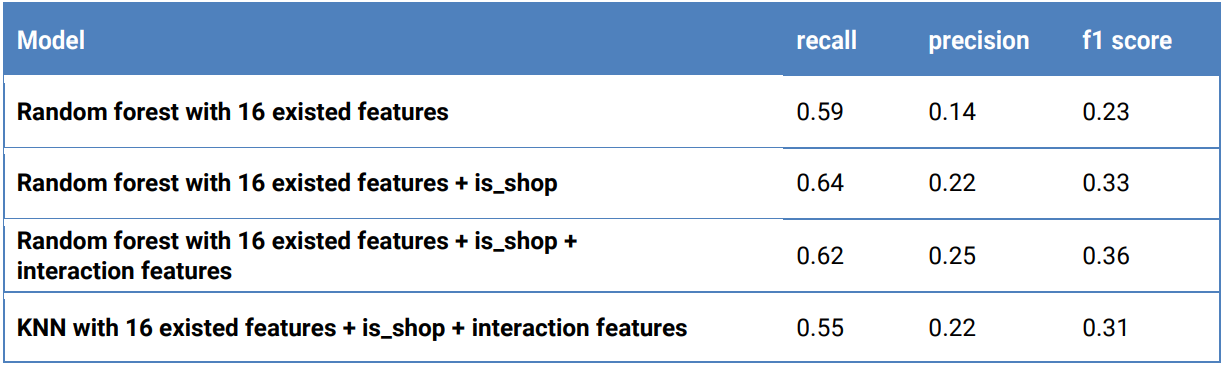
Data modeling
Comments